Oct. 27, 2003
For dolphins, sharks, and bony fish moving at their preferred cruising speed, the ratio of tail frequency and amplitude to forward speed is constrained to a narrow but efficient range of values. This dimensionless ratio is the Strouhal number, and evolution seems to favor efficient swimming motion with a Strouhal number in the range of 0.2–0.4. In the October 16th issue of Nature, Graham K. Taylor et al. show that Strouhal numbers for birds, bats, and insects flying at cruising speed also seem to be constrained to a similar range of values.1
Taylor et al.’s chart of Strouhal numbers for flapping flight and swimming
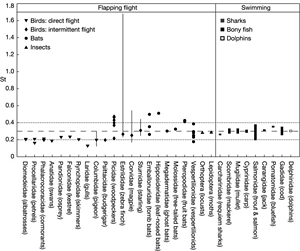
I was surprised to read that the same range of values applied across creatures of wildly different size, mass, and flight patterns, as well as across species that evolved the ability to fly independently. In particular, although the authors of the Nature article provide a chart of Strouhal numbers for flapping flight and swimming along with their statistical analysis, I wanted to see what ratios of amplitude, frequency, and speed actually look like in winged flight, what the Strouhal number actually represents, and why it is dimensionless.
For an animal or insect in flight, the Strouhal number is determined by the frequency (f ) of wing strokes, multiplied by the amplitude (A) of the wing, divided by the animal’s forward speed (U) through the air.
The Strouhal number is equal to f A/U, or :
f A
U
Before discussing what this ratio represents, let’s look at each of the three components: frequency, amplitude, and speed.
For winged flight, frequency (f ) is simply the number of wing beats per second. A complete wing beat has two parts, a downward flapping stroke for power and lift, and an upward stroke for recovery.
For example, when the Common Sheathtail Bat (Taphozous georgianus) flies at cruising speed, it beats its wings an average of 8 times each second, with one stroke and one recovery every .125 seconds.
Wing beat of the Common Sheathtail Bat

The Zebra Finch (Taeniopygia guttata), cruising at a much higher frequency of 26.9 wing beats per second, beats its wings almost three and a half times within the same amount of time.
Wing beat of the Zebra Finch

Although beats per second is an appropriate unit for measuring winged flight, frequency can also be measured more generally, in Hertz (Hz). Since 1 Hz = 1 cycle per second, the Common Sheathtail Bat cruises at a frequency of 8 Hz, and the Zebra Finch cruises at 26.9 Hz.
Note that these diagrams assume direct flight with an even, symmetrical stroke and recovery. In the real world, many animals use an asymmetrical wing beat with a slower downstroke and a faster upstroke, and some smaller birds use intermediate flight patterns that alternate flapping with bounding or gliding motions.2,3
Also known as wingtip excursion, the amplitude (A) of the stroke is the vertical distance traveled by the tip of the wing during the flapping stroke.
Different species use different angles of attack when flying, so a correct display of amplitude must either measure perpendicular to the angle of attack, or normalize the angle by rotating each animal to the vertical.
Amplitude perpendicular to the angle of attack
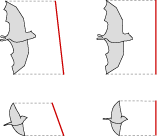
Rising and falling flight line

Relative flight line

An animal’s body also naturally rises or falls with every wing beat, creating an undulating motion that can obscure the actual movement of the wing relative to the body.
To show wing movement accurately, a relative flight line is best, with the animal’s body maintaining an even height through the entire wing beat.
Rising and falling flight line

Relative flight line

Assuming a symmetric flight motion, a normalized angle of attack, and a relative flight line, the wing tip descends in a smooth curve through the flapping stroke (red line), and rises through the recovery (gray line), tracing an even waveform.
Flight waveform of the Common Sheathtail Bat

Amplitude of the Common Sheathtail Bat and the Zebra Finch
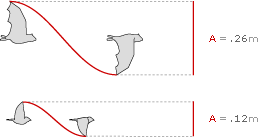
Amplitude is simply the height of the flight waveform, so the Common Sheathtail Bat cruises with an amplitude of 26 cm, while the Zebra Finch cruises with an amplitude of 12 cm.
Of course in the real world different species use different flapping motions and flight patterns, but simplified waveforms allow for easy comparison.
Forward speed (U) in flight is measured as distance traveled per second. The Common Sheathtail Bat cruises at a speed of 6.1 meters per second, covering just over 3 meters in 1/2 second:

So far, we have used simplified waveforms to show amplitude, frequency, and distance (or speed) in a waveform.
Waveforms can be placed side by side for comparison: below are five examples of cruising flight showing amplitude, frequency, and distance over 1/2 second for the Wandering Albatross (Diomedea exulans), the Eurasian Kestrel, the Common Sheathtail Bat, the Zebra Finch, and the Neotropical Moth (Urania fulgens).
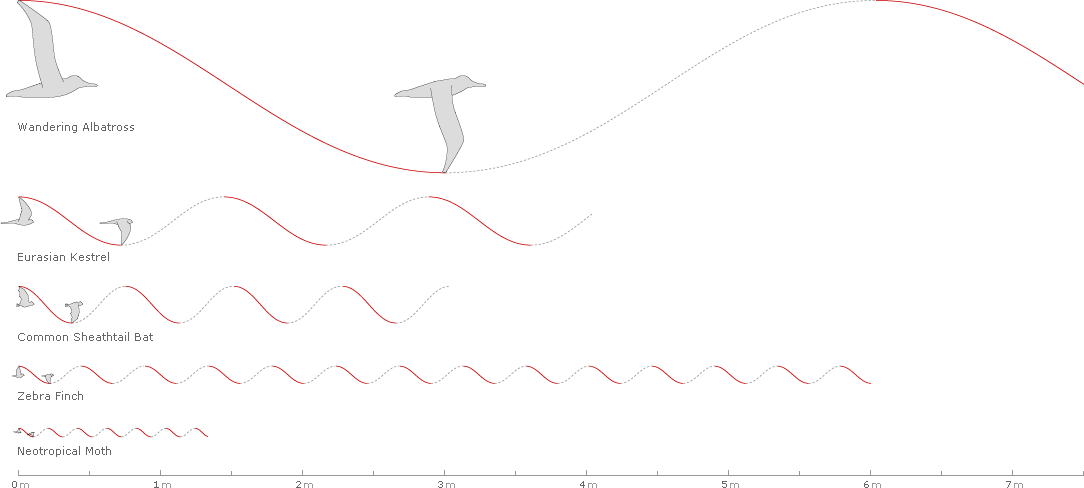
Still, this tells us nothing about Strouhal numbers.
The Eurasian Kestrel (Falco tinnunculus) cruises with a frequency of 5.61 strokes per second, an amplitude of 0.339 meters per stroke, and a speed of 8.1 meters per second.
Recall that for a winged animal, the Strouhal number is the ratio of the frequency (f ) of wing strokes, times the amplitude (A) of the wing, divided by the animal’s forward speed (U):
f A
U
Or, for the kestrel:
(5.61 strokes/second) x (.339 meters/stroke)
(8.1 meters/second)
The strokes cancel each other out, leaving:
1.9 (meters/second)
8.1 (meters/second)
Which is a ratio of the vertical distance traveled by the tip of the wing during the flapping stroke (f A) over the speed of the animal (U).
The meters per second also cancel each other out, leaving:
1.9
8.1
Which yields a Strouhal number of .235 for the Eurasian Kestrel, well within the range of 0.2–0.4 predicted for efficient cruising. The ratio is called a dimensionless parameter because the strokes, meters, and seconds have canceled themselves out, leaving no unit of measurement.
At 5.61 strokes per second, an amplitude of 0.339 meters per stroke, and a speed of 8.1 meters per second, the simplified waveform for the Eurasian Kestrel over 1/2 second of cruising flight would be:

After 1/2 second, the kestrel has completed 2.8 wing beats, and traveled 4.05 meters:

To determine the average distance traveled by the wing tip in 1/2 second, we can extend the graph 2.8 times vertically (the graph actually shows 3 complete downstrokes, but since the wing has fully beat only 2.8 times, the number will average to 2.8 for any flight longer than a few seconds).

This effectively multiplies the amplitude (.339 meters per stroke) by the frequency (2.8 beats per half second) along the graph’s y-axis. The x-axis already indicates speed (4.05 meters per half second), so we have just graphed the familiar equation:
f A
U
... and the kestral’s Strouhal number (St) of .235 is represented by the slope (St=y/x).

Adding slopes for St=.2 and St=.4 delineates the predicted range of Strouhal numbers for efficient flight cruising:

Note that the slope of the first complete wavelength in the lower left of this chart also falls on the Strouhal slope (St=.235). Since distance covered is the same as frequency times wavelength, we can divide both the y-axis and the x-axis by frequency, yielding a simple wavelength:

Or, at a larger scale:

As shown above, Strouhal numbers (y/x) can be determined from simplified kinematic waveforms of wing amplitude (y-axis) and wavelength (x-axis).
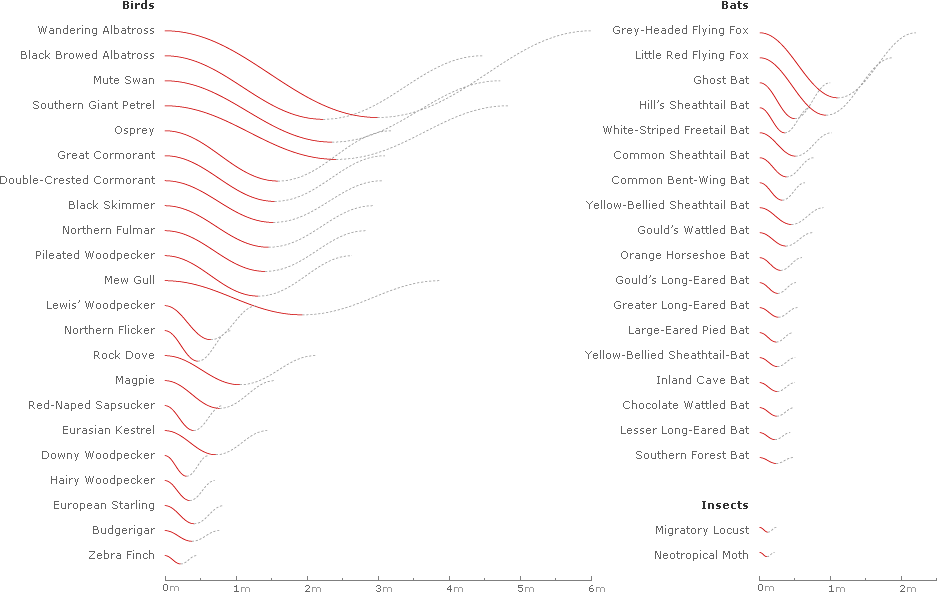
Generating waveforms for all of the 42 species of birds, bats, and insects sampled in Taylor et al.’s Nature article1 yields the following chart, with each list sorted by decreasing amplitude:
Inverting and superimposing all 42 wavelengths on a common origin gives some sense of the range of the data sample:

Plotting the rise and run of each wave gives a chart of Strouhal numbers for all 42 species:

For the 22 species of birds:

For the 20 species of bats:

Or for the 2 species of insects (Taylor et al. rightly note that there is not enough published kinematic data on cruising insects to draw conclusions for all insects):1

And finally, the waves can be removed, and the 42 Strouhal numbers can be graphed against the predicted range of .2–.4:

It’s tempting to look for patterns in the graphs: Strouhal numbers for birds seem to fall on the lower end of the predicted range (closer to .2), while bat species tend to fall on the higher end (closer to .4). Similarly, Strouhal numbers for relatively large birds (amplitude larger than .5 meters) also seem to hug the lower end of the predicted range.
Still, it’s important to keep in mind that these charts do not attempt to draw statistical conclusions, and must be viewed in the context of the statistical analysis provided in Taylor et al.’s Nature article.
Special thanks to Graham Taylor for kindly providing the kinematic data used in his Nature article, and for suggesting further directions for statistical analysis.